MENU

In the know with Near Infrared

16. Mar, 2023
By Richard Mills, Journalist, FOSS
Near infrared (NIR) analysis has become an essential quality control tool for grain handlers around the world, but can it do more to help face unprecedented challenges to grain quality throughout the supply chain? See our list of ‘must-know’ things to consider in any grain testing strategy.

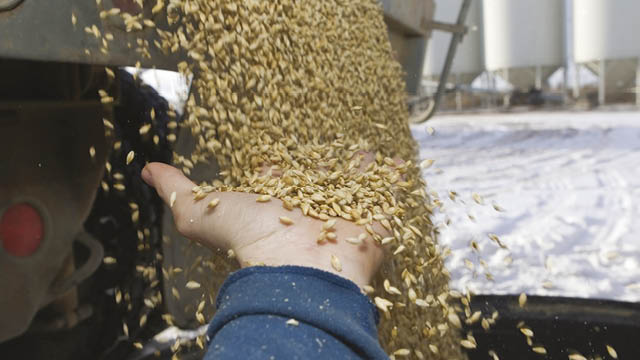
Varying quality in, consistent quality out. The fundamental challenge of grain handling has never been more apparent as the industry strives to ensure deliveries on spec while making the best of grain supplies under threat from extreme weather and ongoing geopolitical events. 

Introduced in the nineteen eighties, near infrared analysis has proven increasingly valuable to the business of grain handling. When deciding payment at delivery, when blending to customer specs, when loading onto transport, when it’s received for milling or malting and when it’s traded on global commodity markets, the ease of use and reliability of near infrared analysis has ensured that grain handlers can deliver higher quality products from the same finite supply of grain from the field. 

So what has made near infrared analysis of grain such a powerful tool and what should we look at when deciding analytical operations for the future? 


Looking inside the kernel – the evolution of near infrared transmittance

Near infrared (NIR) makes use of the naturally occurring electromagnetic spectrum defined by wavelengths between 700nm and 2500nm. NIR is an accurate and rapid analysis method that is well suited for quantitative determination of the major constituents in most types of food and agricultural products. In particular, it provides a stable platform for robust analytical solutions that can be used in harsh environments subject to vibration, dust and fluctuations in humidity and temperature. 

NIR can be done in transmittance or reflectance. In transmittance, an infrared spectrum can be obtained by passing infrared light through a sample and determining what fraction is absorbed by the sample. Alternatively, light can be reflected from the sample and the absorption properties can be extracted from the reflected light (reflectance). 

The detail about transmittance is relevant for whole grain, for instance, when testing parameters such as moisture which can be unevenly distributed in the kernel and so affect the result if only the surface is measured. Transmittance ensures that the grain is measured in depth to provide enough data for an accurate measurement. 


infratec
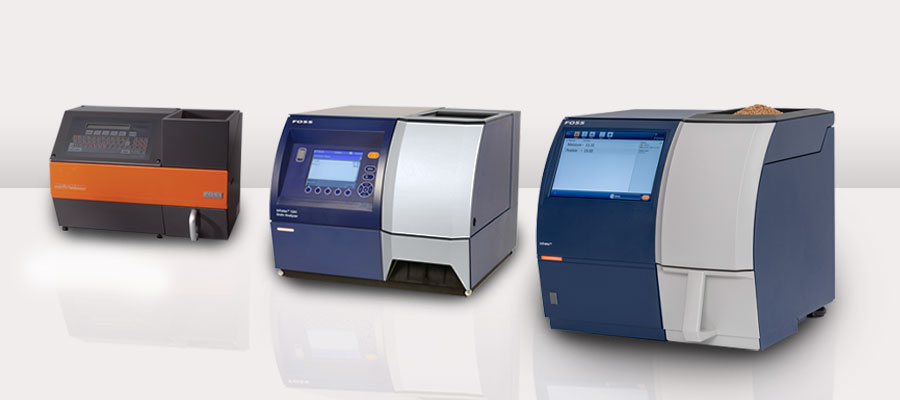
The changing face of NIR grain analysis seen through the well-known Infratec™ grain analyzer


Data collection lays the ground for a growing range of applications
The first applications for grain analysers based on NIR transmittance were for wheat, corn, barley, soya and rice for parameters such as moisture, protein and oil content. 

Approvals quickly followed, for example, by organizations such as the Federal Grain Inspection Service (USA). At the same time, the development of more applications models gathered pace. Note that the models are often referred to as calibrations and are also now known as ‘analytics packages’ in relation to FOSS solutions.


In simple terms, an application model converts the spectrum measured by the instrumentation into a usable value for the end user.  A critical aspect of this work is to have enough data and a sufficiently varied range of data to make a valid application model that can handle the natural variations in characteristics of grain samples across different regions and harvest seasons. The world is a pretty big place when it comes to growing grain and growing seasons continue to surprise with ever more extreme weather events. In short, the more data that can be put into a model the better so that we can accurately describe the many variations that we can expect to find in a single grain sample. 


In 1996, a powerful form of application modelling called Artificial Neural Network models (ANN) was introduced to handle the range and complexity of data. The ANN models have contributed to highly stable performance regardless of weather and region. Such performance has been demonstrated by years of ring tests against results from reference laboratories. Today, well-established data models for the latest generation Infratec instruments contain as many as 50.000 samples or more representing over 35 years of seasonal variations. The range of applications continues to grow as shown in this fold-down table: 

Infratec™ and Infratec NOVA

 Product Sample Type                                       Parameter
Oilseeds  Soybean meal  Oil, moisture, protein
Soybean  Oil, moisture, protein 
Canola (rapeseed)  Oil, moisture, protein 
Milled sunflower  Oil, moisture 
Mustard seeds Oil, moisture 
Grain  Corn (maize)  Oil, moisture, protein, starch 
Barley Moisture, protein 
Malted barley Moisture, protein, soluble protein, extract 
Green malt  Moisture
Wheat, durum Moisture, protein, starch, wet gluten, zeleny
Wheat flour  Moisture, protein, ash, water absorption, wet gluten 
Whole meal flour Moisture, protein, ash 
Durum wheat  Moisture, protein
Durum flour Moisture, protein, ash 
Buckwheat Moisture
Rye Moisture, protein
Rye and mixed flour  Moisture, protein, ash
Oats  Moisture, protein 
Sorghum Moisture, protein, starch 
Triticale Moisture, protein
Rice Brown rice  Moisture, protein, amylose 
Milled rice  Moisture, protein, amylose 
Rough rice  Moisture 
Beans and pulses  Field peas Moisture, protein  
Chickpea  Moisture 
Field beans Moisture, protein  
Lentil Moisture, protein  
Lupins Moisture, protein 


Fleets of high performance instruments
While the stability and range of individual instruments evolved, many grain handlers found that by linking analytical instruments in grain networks they could gather valuable data from multiple analysers in one place. A while later, networking software was developed that not only allowed grain handlers to collect data, but also to remotely configure instruments, for example, when updates to application models became available to accommodate the latest growing season, they could be pushed out to multiple instruments in one go from a single desktop. 

As anyone who has tried looking after a number of instruments without such connectivity will testify, keeping them all in check and up to date, can be a time-consuming task, especially across different geographic locations. The ability to do it once from a desktop can be safely said to have saved thousands of man-hours.

Reliability is the sum of many things  
In step with developments in networks, the reliability of results on an instrument-to-instrument basis was also greatly improved in the late nineties. This brings us to a final ‘need to know’ concept called transferability. 

Transferability means that measurements done with different instruments on the same sample give identical results. An indication of transferability therefore helps users of the NIR analysis equipment to understand the reliability of the measurements popping up on the screens of the instruments in use across the organization. 

Transferability is affected by factors related to both instrumentation and the application model.

On an instrument level, the repeatability of measurements, the accuracy of measurements and comparisons from one instrument unit to another are important. On an application model level, the variables can include factors such as the number and source of NIR measurements used to create the model, not to mention the number of reference tests and potential error between those reference tests. 

The application model makes a ‘prediction’ of the result based on the data used in the model. The term, ‘standard error of prediction’ (SEP) is therefore used to sum up the potential error against reference results determined by the actual chemical properties of the sample. SEP is typically stated in technical documentation such as applications notes. Another useful tool in any application note is a graph showing results from the NIR instrument plotted against the corresponding reference results for a number of samples. This provides a source for performance-related statistics, for example, SEP, see figure 2.                   

The topic of SEP can easily become rather detailed, but what is critical for your operations is that you have a correct and reliable statement about what to expect in terms of potential error. Imagine, for example, that you are running a population of instruments across different sites and that you are grading grain for payment according to a target of 10.5 protein. Firstly, it is important to know that the instrument is correct and measurement is correct and the potential error is low. Secondly, it is essential that the performance is consistent wherever and whenever measurements are made. Only in this way can you ensure that payment tests will be reliable and trustworthy across all sites. 


graph

Figure 2: Typical plot from application note


In-line NIR – the new frontier 
Transferability has provided a cornerstone for the latest evolution of the NIR grain analysis where ‘in-line’ sensors measure continuously in the grain handling process. For instance, this could be as grain is transported into the silo at receival, as it is blended before loading onto a ship, as it is received at the malting plant or as it is blended before heading into the flour milling process. 

The big advantage of in-line analysis compared to tests with a traditional benchtop analyzer is that measurements are taken automatically every few seconds. The FOSS product portfolio provides an example of this logical evolution in the form of the Infratec™ grain analyser and the ProFoss™ 2 whole grain in-line solution. The Infratec is widely recognized for its reliable measurements due to attributes already covered in this article. It therefore makes perfect sense that the analytics packages used for the ProFoss are based on data used to develop analytics packages for the Infratec. Furthermore, networking and connectivity software makes it simple to check the performance of the in-line sensor against the rock-solid Infratec.

In-line analysis allows key control parameters to be more closely monitored allowing tighter control against targets. For example, assume that you are building a 20,000 ton ship load of grain to a target of 10.5% protein. You are using two grades of wheat and there is a price difference of EUR 10 between the grades. The real-time data offers insight that allows you to use 15% more wheat from the lower grade wheat and save 15% high quality wheat. Given the 20,000 load, 15% equals 3,000 tons of grain at EUR 10 higher price, resulting in a saving of EUR 30,000. Read more.

The potential of NIR grain analysis 
The advances made by NIR technology offer a useful checklist when deciding future analytical strategy.  

The power of NIR transmittance technology to get a clear picture of what is going on inside the grain kernel is an obvious requirement for any whole grain solution. Similarly, the ability of an instrument to perform perfectly in the non-lab like conditions at the weighbridge is another. These hardware aspects are nothing however without robust application models based on sufficiently rich pool of data from both reference tests and NIR tests. And the availability of networking software and connectivity are essential for running any number of instruments from a single central location. 

Pulling all the threads together is the concept of transferability and its promise of identical measurements wherever analysis is performed.  This provides a secure foundation for any analytical strategy involving multiple instruments across sites and locations. Furthermore, transferability in combination with advanced software, lays the ground for the exploitation of in-line analysis by making it simple to ensure in-line performance aligned with that of well-proven benchtop NIR solutions. 
 

Learn more

Discuss the value of rapid and easy-to-use analytical solutions when making important decisions throughout grain handling Let's talk